

Secret treasures are always fun. And when I was examining the endpoint list from my previous post, I noticed a few hints that I couldn't leave unexplored. It turns out that just as the previous versions, Optimizely CMS 12 comes with a couple of hidden debug gems.
There is a DebugController with a few, but pretty useful listings included out-of-the-box in the CMS. However, in order to see them your user has to be "Administrators". Now, with the default IdentityProviders and not so many out-of-the-box VirtualRoles, that's not what my user was, but since it's just a string check on roles, it was easily fixed by creating a group in Admin mode called "Administrators" and adding my user there.
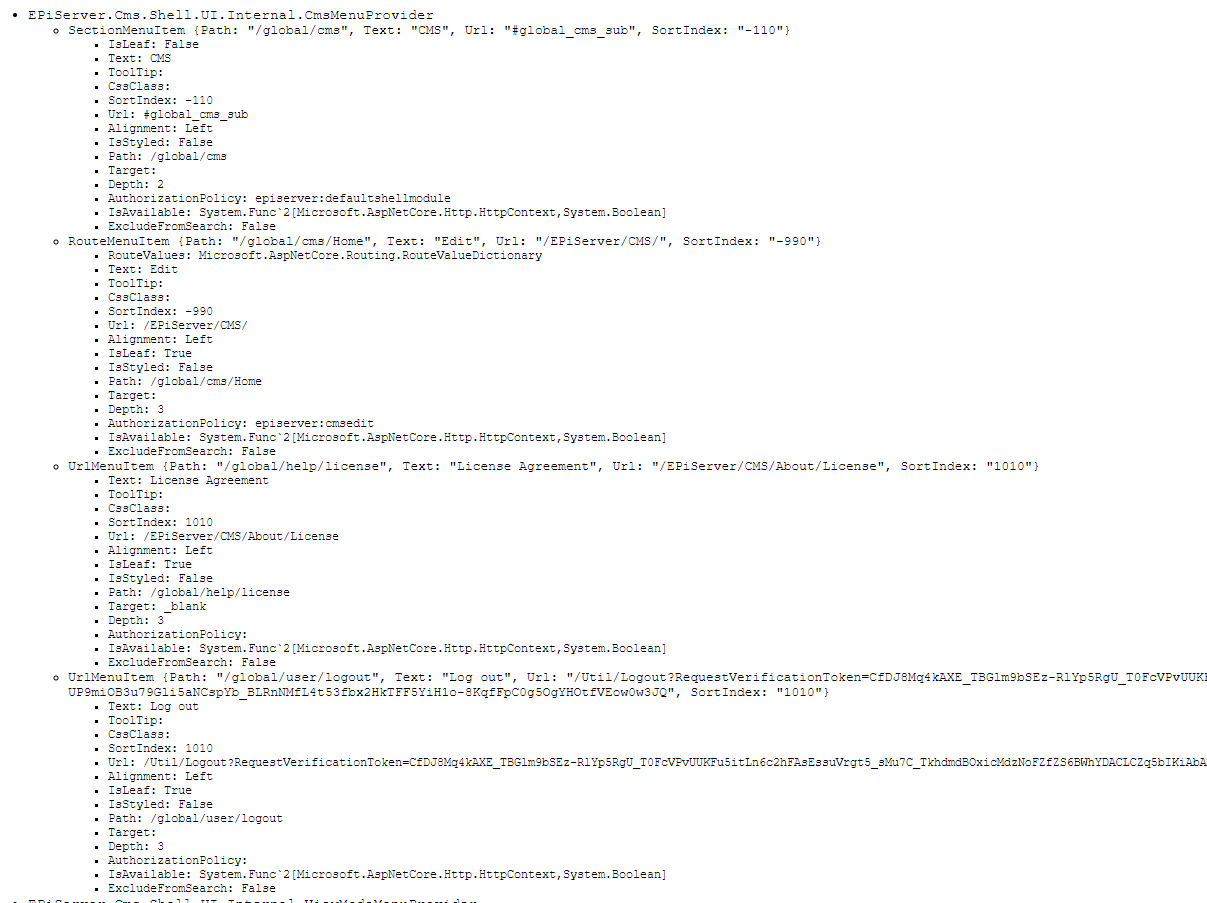
Tool to see registered menu providers
On the route: /episerver/shell/debug/menu
I found this practical list:
FileVersions
And sometimes it can also be pretty useful to know exactly which versions of the various assemblies are loaded. Like you can see here:
/episerver/shell/debug/ShowFileVersions
It looks like this:

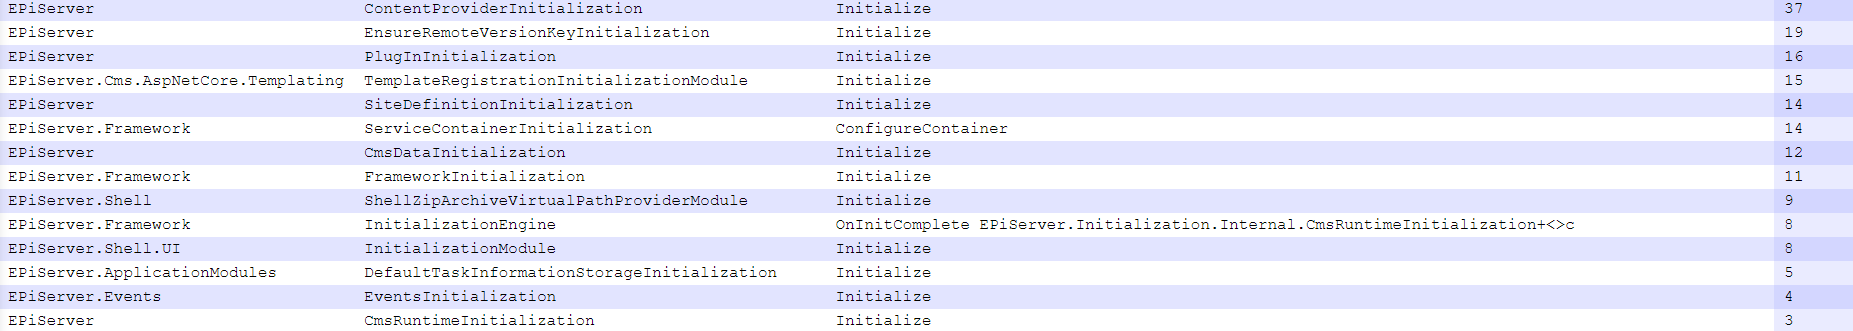
TimeMeters
And finally we have classic listing of where the startup time was spent.
/episerver/shell/debug/ShowTimeMeters
Very practical when optimizing for performance - although I must admit that everything running on .net 5 seems to be blazingly fast!
There is also another view for showing StructureMap services - but since it's not the default DI anymore I am not sure how useful it is.
Granted, it's not the full DeveloperTools which I'm looking forward to being released for CMS 12 - but it's a starting point.